QUANTITATIVE DATA

Now that we have a good understanding of the different parts of research, we have to start separating the questions we have written down into separate, distinct groups of data.
These groups, namely quantitative and qualitative, will help us to understand what forms of research we will have to conduct to answer these questions completely and competently, with enough detail to be of actual use.
In this section, we'll be talking about quantitative data.
What is quantitative data?
Quantitative data is often described as 'hard' data. That's because it deals purely with numbers; numerical data, facts, and figures. It is described as objective data, because, essentially, it cannot be 'argued' with or disputed over in the ways opinion-based (or qualitative) data can.
This form of data seeks to quantify findings for analysis in ways that are more factual and discrete. It allows researchers to easily present findings visually too, in the form of graphs and diagrams.
Within the realm of quantitative data, we find two 'sub-forms' of data, called discrete and continuous.
Discrete
Discrete data is data that can be categorized, with distinct classifications. It is based on "counts" where only a finite number of values can exist.
This type of data cannot be subdivided usefully; for example, a category may be 'number of people'. 'Number of people' could be one, or two, or three, but not one and a half, because you cannot sensibly state that you saw 'one and half' people cross a road, for example - it is just not possible!
For example, as part of our film research, we could send out a questionnaire asking the question 'what colour do you associate with horror?'.
Our responses could be red, blue, yellow, green, black, white, and so on. These are separate categories, and as such are discrete forms of data. We might want to present our findings in a bar graph.
Continuous
Continuous data is the opposite of discrete data. These are values that can essentially get more and more precise; they can be subdivided meaningfully.
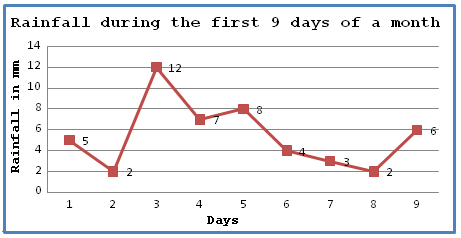
This form of data can be put on a scale too. For example, we could measure 'a person's height'. We could get a measurement to the nearest meter, but we could go more and more precise to a centimeter, to a millimeter, etcetera. Our reading for 'a person's height' could be 1.258203828... meters, and we could get even more precise.
This data can be presented as a line graph, which looks like this:
Case study
Your school principal has issued a crackdown on bad school uniform. There are new rules in place, and if you don't follow them, you get a note home.
How could we quantify change in uniform standards to evaluate whether the new uniform policy has been effective?
One approach we could take is to call in all the people who have received a yellow slip and see whether their uniform standards have improved. This would give us quantitative data (yes/no) which could be put into a graph.
-
A benefit of this technique is that it is simple and easy to execute but will still give us meaningful results.
-
However, it may not be very reliable - there is a possibility that students who did not conform to the new rules did not end up getting notes and got away. This means that, even by calling in everyone who got a note, we are not getting the complete rule-breaking student body.
-
Also, unless we check these uniform standards daily, we may not be getting an accurate representation of any changes in uniform policy because it could be possible that the uniform rule-breaking was a one-off event for some students. It could also be the other way round; students who normally wear their uniform badly may have just changed from their PE uniform and as such will look presentable, although this presentability may not last long.
Another approach that could be taken is to do a field analysis (observation) at the entrance of the school before and after the policy is put into place, to count how many people are violating the rules.
-
This may be more fair as instead of calling people in (i.e. giving them warning and time to adjust their uniform), we are doing an observation. For this to even remotely be a fair test, however, we would have to stand in many locations at many times of day.
-
However, there are so many variables in when and where to conduct the observation that it may not at all turn out to be reliable. There will be places in a school which are more busy (or where the same people repeatedly come and go), places in which boys hang out, places in which girls hang out, stairs, walkways, rooftops, playgrounds, classrooms, and more. In a hypothetical fair test, we would have to conduct an experiment in almost every location, which is simply impractical.
-
Also, certain locations may be more busy than others at certain times. Entrances and exits will see varied levels of traffic during lesson changeovers, before school, and after school. Certain locations may be closed off during school hours, such as entry gates, and some after school hours, such as classrooms.
We could also send out a questionnaire to the student, parent and teacher body asking them to rate changes in the uniform standards.
-
Although some may argue that this is a qualitative approach, certain questions can include a scale (for example, from one to ten; one being 'not at all' and ten being 'completely') or multiple-choice questions (with answer options like 'yes' and/or 'no'). This allows us to numerically gauge stakeholders' opinions, while reserving the capability to graphically present this data.
-
However, one question is: who can we rely on to give us reliable data? Will students actually tell us whether they have 'ever broken the rules'? Will parents admit that their children may not actually have been 'meeting uniform expectations'? And will teachers take the risk of admitting that they may not have given out notes when they should have, or that they have 'seen no change in the uniform standards'?
-
In addition, we may find that experiments and observations come out to be more reliable than opinion-based quantitative research. But when can we actually definitively say so? A mix of both types of data is healthy, but it could be that the responses we are getting are not what they were expected to be.
Evaluation
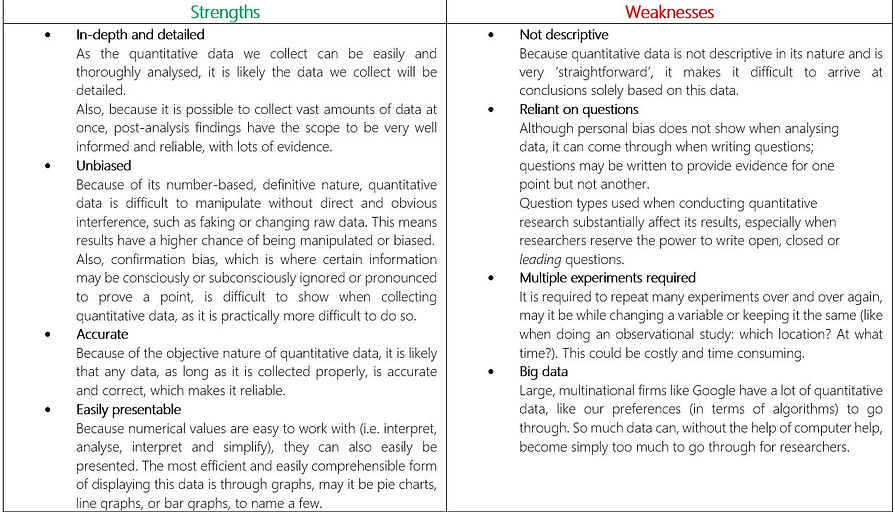
Now let's evaluate the strengths and weaknesses of quantitative data. We can always refer back to this when making our research choices, because it is a good way to check throughout the research stage on whether our experiments are actually of use.
Remember: researchers get paid money in real life for the work they do. If what they produce is not of actual use, then they haven't done their job.
In essence:


